

How is success reported and how should we discuss this with patients?
Dr. Stephanie Kearney is a Lecturer in Vision Sciences at Glasgow Caledonian University. Read More
There has been a substantial increase in the amount of research supporting the efficacy of myopia interventions including orthokeratology, defocus inducing spectacle lenses, and soft dual focus and multifocal contact lenses.(1) The effectiveness i.e. efficacy, of an intervention is usually reported as the average slowing in spherical equivalent refraction (SER: sphere+(0.5*cyl)), measured by cycloplegic autorefraction, and the slowing of axial elongation (in millimeters). This slowing is calculated as the difference in the average rate of progression in a control group of children (wearing single vision correction) compared to an intervention group (wearing myopia control glasses or contact lenses) over a period of time.

How effective is myopia management?
Use of percentages
Studies report the effectiveness of myopia interventions as a percentage as well as the amount of slowing in SER and axial length. However, reliance on reporting percentages alone is likely to be misleading.(2) The limitations of percentages include that they don’t consider the actual rate of progression. For example, a fast progressor may not achieve a greater treatment effect than a slow progressor, as would be suggested by a quoted percentage.(2) Therefore, caution should be taken when discussing expected efficacy with parents to ensure that realistic expectations are set and the variability of treatment effects are considered, as discussed in the following section. When reviewing research papers, it’s important to consider the amount of slowing in progression. One such example is the reported efficacy of MiYOSMART glasses which slow progression by, on average, 0.17mm/yr and 0.25D/yr.(3) This is the average slowing in progression per year that could be expected using this type of intervention, and factors in that this may be similar for those that are progressing previously at different rates. Average values such as these are useful in condensing large amounts of information into a single applicable value. However, they don’t account for individual variation as not every child will respond in the same way. Because of this, research also reports values such as the standard deviation or confidence intervals which indicate the amount of variability in the response to intervention.
Variability in treatment effects
A recent clinical study by myself and colleagues found that 50% of children had a slowing in progression and although this meets the average slowing reported in literature, there was considerable variability with some children responding better to treatment than others.(4) Therefore, when reading research papers, it’s important to also look at variability in treatment effect as indicated by values such as standard deviation and confidence interval values. If we take the example of the MiYOSMART glasses with an average slowing of progression by 0.25D/year and 0.17mm/year, the authors report a confidence interval of -0.73 to -0.37D for refraction over the 2-year study period.(3) This is the range of values within which we can be 95% certain that the treatment effect future children prescribed with the treatment will have. Or more simply put, the treatment effect could range within 0.37D to 0.73D slowing over a 2-year period. Because of this, discussions with parents should state clearly that treatment effects are variable and there is no guarantee the child’s progression will slow by the average value.
Another number to consider when reading papers is the percentage of non-responders. These are children who have not achieved the desired treatment effect. However, how should we categorize a non-responder? Some research suggests a non-responder progresses more than 0.11mm/yr (5) whilst other research using dioptres suggests a non-responder progresses at more than -0.50D per year.(6) However, neither of these statements consider the rate of progression prior to starting intervention, or the difference and impact of age, which will both have an influence on the result.
It’s important to note that in cases where the child’s progression does not seem to slow with intervention, there is no evidence to suggest that switching to an alternative optical intervention will improve efficacy. Instead, it’s important to recall that variability in treatment success is expected and the child may have progressed at an even faster rate if intervention had not been commenced.
How to decide if treatment has been successful
Evaluating treatment success is important from a patient management perspective particularly considering the time and cost invested by the parent and child. There is no consensus on this as of yet, as indicated by the various methods of defining responders, but research is emerging on the most appropriate method to evaluate success. (7-8)
The paper by myself and colleagues (7) explored various methods of evaluating treatment success within a series of clinic patients. The method which was most appropriate and easily applied to clinical practice appeared to be the Mean Efficacy Method.
This method calculates the rate of axial elongation after starting intervention and subtracts this from the rate of axial elongation before starting intervention. The difference in growth rate is then calculated and matched with the relevant research study for that intervention e.g. an average expected slowing of 0.17mm/yr would be expected with MiYOSMART.(3)
For simplicity, let’s assume the child is wearing MiYOSMART and so we will use the target of 0.17mm/yr:
Axial length before starting intervention:
Age (years) | Axial length right eye (mm) |
7 | 23.78 |
7.5 | 23.86 |
8 | 24.02 |
Rate per year | 0.24 |
Axial length after starting intervention
Age (years) | Axial length right eye (mm) |
8 | 24.02 |
8.5 | 24.08 |
9 | 24.18 |
Rate per year | 0.16 |
Change in progression:
0.24mm/year-0.16mm/year= 0.08
This value of 0.08mm/year is less than 0.17mm/year(3) and therefore treatment has not been successful. Although there has been a small amount of slowing in progression, it is less than would be expected based on the evidence. Therefore, this child could be determined to not have responded to treatment.
The strengths of this method are that it uses scientific evidence to estimate treatment success, and it uses axial length which is much more precise and less variable than refraction(9-10). It's important to note that the axial length measurements referred to in this paper were determined by measuring axial length using biometry. This is due to significant variability with the use of axial length calculators meaning they are not suitable at all for monitoring progression or evaluating treatment success.(11)
One limitation of the method is that long term changes in evaluating treatment success may be influenced by slowing in progression with age. Another point to consider is that further research exploring if previous progression predicts future progression is required as evidence is at times inconclusive(12-13) and has relied on ultrasonography to measure axial length which is more variable when detecting changes over time in children than modern methods of biometry.(14)
Further support and learning: Myopia Management Module at Glasgow Caledonian University
There is now a range of CPD support available to practitioners but despite this, 79% and 67% of practitioners we surveyed reported that confidence and knowledge, respectively, are barriers to them practicing myopia management comfortably.
This is why the Myopia Management Module at Glasgow Caledonian University (GCU), was developed; we provide an unbiased source of CPD to provide tools for clinical practice, including risk calculators and tools to evaluate treatment success. After completing the course, a 3-fold decrease in the number of practitioners not dispensing interventions has been reported (Fig 1), along with comments of improved clinical practice including; how advice is often provided at an earlier point in the patients journey such as for pre-myopes and newly progressing myopes, and knowing how often the risk of progression and the success of the intervention should be evaluated.
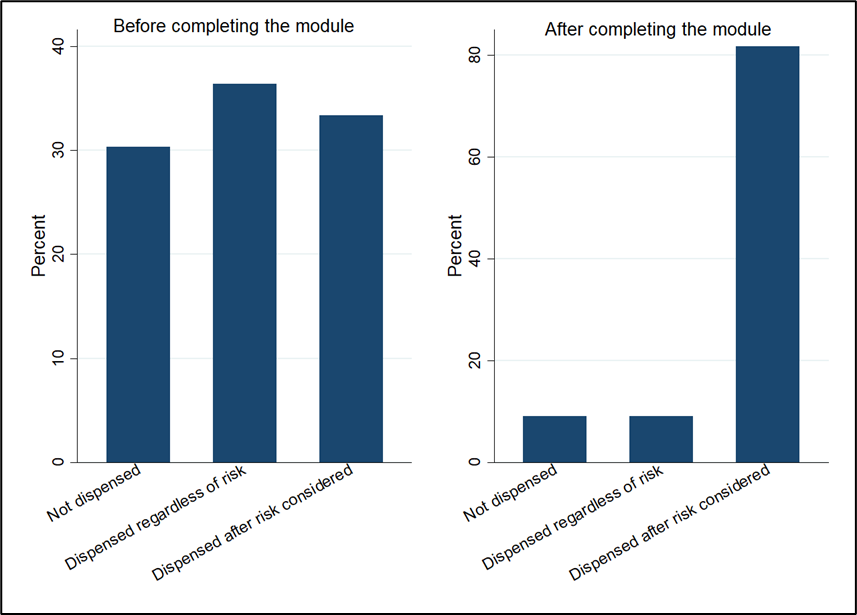
Figure 1. Bar chart showing the change in dispensing decisions for myopia interventions before and after completing the module. There was an increase in the number of practitioners considering risk of progression before dispensing and a decrease in the number not dispensing intervention.
The majority of completed students reported work place satisfaction increased (54%) and there were less concerns over patient complaints (87%). These findings highlight that independent sources of CPD such as the Myopia Management Module at GCU can make a significant difference to the clinical practice of those that take it up.
“my perception about myopia management has totally changed now”
“it has given me so much confidence in my clinical practice”
For further information on the Module please click here. For how to apply or for any questions, please email myself by email which can be found within the short bio or below
References
1. Wildsoet CD, Chia A, Cho P et al. “IMI – Interventions for Controlling Myopia Onset and Progression Report. .” Invest. Ophthalmol. Vis. Sci., 2019: 60(3):M106-M131.
2. Brennan NA, Toubouti YM, Cheng X, Bullimore MA. “ Efficacy in myopia control. Prog Retin Eye Res. .” 2021: Jul;83:100923.
3. Lam CSY, Tang WC, Tse DY, Lee RPK, Chun RKM, Hasegawa K, Qi H, Hatanaka T, To CH. “Defocus Incorporated Multiple Segments (DIMS) spectacle lenses slow myopia progression: a 2-year randomised clinical trial. .” Br J Ophthalmol. , 2020: Mar;104(3):363-368.
4. Day M and Kearney S. Myopia optical treatments within a UK clinic population are less successful than in clinical trials. Invest. Ophthalmol. Vis. Sci. 2024;65(7):2749.
5. Prieto-Garrido FL, Hernández Verdejo JL, Villa-Collar C, Ruiz-Pomeda A. “Predicting factors for progression of the myopia in the MiSight assessment study Spain (MASS). .” J Optom., 2022: doi: 10.1016/j.optom.2020.11.003. Jan-Mar;15(1):78-87.
6. Jethani, J. “Effect of defocus incorporated multiple segments lenses on halting myopia progression not responding to low-concentration atropine (0.01%) eye drops",.” Indian Journal of Ophthalmology, 2024: 72:S709-S711.
7. Kearney S, Seidel D and Day M. “Evaluating treatment effectiveness in a case series of myopia patients.”Optometry and Contact Lenses, 2022: https://doi.org/10.54352/dozv.QXRF8309.
8. Bullimore, M.A. & Brennan, N.A. “Juvenile-onset myopia-who to treat and how to evaluate success.” Eye (London, England),, 2024: 38; 3: 450-454.
9. Lam AKC, Chan R and Pang PCK. The repeatability and accuracy of axial length and anterior chamber depth measurements from the IOLMaster. Ophthal Physiol Opt (2001); 21: 477-483.
10. Zadnik K, Mutti DO, Adams AJ. The repeatability of measurement of the ocular components. Invest Ophthalmol Vis Sci. 1992; (7):2325-33.
11. Morgan PB, McCullough SJ, Saunders KJ. “Estimation of ocular axial length from conventional optometric measures. .” Cont Lens Anterior Eye., 2020: 43(1):18-20.
12. Matsumura S, Lanca C, Htoon HM, et al. “ Annual Myopia Progression and Subsequent 2-Year Myopia Progression in Singaporean Children. .” Transl Vis Sci Technol , 2020: Transl Vis Sci Technol 2020;9:12.
13. Mutti DO, Sinnott LT, Brennan NA, et al. “The Limited Value of Prior Change in Predicting Future Progression of Juvenile-onset Myopia.” Optom Vis Sci, 2022: 99:424-33.
14. Carkeet A , Saw S, Gazzard G Tang . & Tan DT. (2004). Repeatability of IOLMaster Biometry in Children. Optometry and Vision Science, 81 (11), 829-834. doi:
Author:
Dr. Stephanie Kearney
Research Optometrist and Lecturer
Department of Vision Sciences
Stephanie is a lecturer in Vision Sciences and module leader of the Myopia Management CPD Module.
Stephanie graduated with a degree in Optometry from Ulster University in 2012 and after completing the pre-registration year, qualified as an Optometrist in 2013. Stephanie returned to Ulster University in 2013 and completed a PhD in 2016 in Myopia and its association with environmental factors.
She then spent two years working in the community as an Optometrist before completing her Independent Prescribing diploma at GCU in 2018. Stephanie then took up a post as a Postdoctoral Researcher in the Childhood Atropine for Myopia Progression in the UK (CHAMP) study in 2018 and as a lecturer in 2019. Stephanie was awarded a Postgraduate Certificate in Academic Practice in 2022 and became a Senior Fellow of the Higher Education Academy in 2023.
Stephanie has a particular interest in myopia pathogenesis and control and more recently, the public health aspects of eye care. In addition to these roles, Stephanie also works as part of the Myopia Management Clinic team at GCU.
Comments